
A Shopify sales tracker is so much more than a simple numbers dashboard. I like to think of it as the strategic command center for my entire e-commerce operation. When you get serious about precise sales tracking, you start to uncover hidden growth opportunities, pinpoint underperforming products, and really get a handle on complex customer behavior. For dropshippers, this data is pure gold.
Why Your Shopify Sales Tracker Is More Than Just a Dashboard

So many store owners fall into the trap of seeing their sales tracker as a passive tool—a place to peek at daily revenue and celebrate milestones. But that mindset misses the real power hiding behind the numbers. When you start actively using this data, it can guide every single strategic choice you make, from ad spend allocations to your promotional calendar. It's how you connect raw figures to profitable results.
Moving From Reactive to Proactive Decisions
A reactive approach is waiting until a campaign ends to check the sales data. A proactive strategy means you're using real-time insights to make adjustments on the fly.
Imagine you see a product you sourced from AliExpress suddenly gaining sales velocity. With a proactive mindset, you can immediately double down on its marketing before the trend peaks, not after it's over.
This way of thinking is absolutely essential in today's market. Shopify's growth is staggering—it's processed over $1 trillion in global online sales to date. Just in 2024, its Gross Merchandise Volume (GMV) rocketed to $292.3 billion, a massive jump from the year before. That scale highlights just how crucial it is to have efficient tools to manage and interpret your sales data.
Uncovering Hidden Opportunities in Your Data
Your sales tracker is packed with clues about what your customers truly want. If you dig into the sales patterns, you can spot opportunities that aren't always obvious on the surface.
- Product Bundling: Notice customers are frequently buying two specific items together? Your tracker just handed you a perfect product bundle idea on a silver platter.
- Geographic Targeting: Discover a surprising number of sales coming from a specific region? Maybe it's time to run some geo-targeted ads for that area.
- Time-Based Promotions: See a consistent dip in sales every Wednesday? A mid-week flash sale could be the perfect way to smooth out your revenue curve.
By looking beyond total revenue and into metrics like sales by channel, average order value, and customer lifetime value, you transform your sales tracker from a report card into a roadmap for growth.
Understanding these metrics is the first step. The next is connecting them to your bottom line. When you can properly analyze your sales data, it helps you calculate sales margin with much greater accuracy, making sure every marketing dollar is spent wisely. This shift turns data from a simple record into a powerful asset that fuels smarter, more profitable business decisions.
Unlocking the Power of Shopify's Built-In Analytics
So many store owners jump straight to searching for a third-party sales tracker, completely overlooking the goldmine of data already sitting in their Shopify admin. Before you spend a single dollar on another app, it's absolutely essential to get comfortable with the native analytics suite. Honestly, it’s more than powerful enough for the core insights you need to make smart decisions.
Think of it as your store's mission control. A deep dive into your Shopify Analytics Dashboard is the foundational first step. It’s where you can get a quick, accurate pulse on your business's health without the headache of connecting and learning another tool.
Making Sense of Key Shopify Reports
Instead of getting lost in a sea of metrics, your best bet is to focus on a handful of key reports that tell you the most about what’s really going on. Shopify designed these reports to answer specific, critical questions about your sales, marketing efforts, and customer habits. They cut through the noise and tell you a clear story about what's working and what's not.
For example, take the Online store conversion rate report. It's not just a percentage; it’s a direct vital sign for your store. If you see a sudden drop, that's an immediate red flag. It could signal anything from a technical glitch, like a broken checkout button, to a strategic misstep, like a new ad campaign driving the wrong kind of traffic to your site.
Another one I always keep an eye on is the Top products by units sold report. This is your direct line into what your customers truly want. You can use this insight to guide everything from inventory forecasting to creating new product bundles or even just featuring your best-sellers more prominently on the homepage.
Matching Reports to Your Business Questions
The real magic happens when you know which report to pull up to answer a specific business question. This targeted approach is a huge time-saver and keeps you from getting buried in data. You don't need to check every single report every day. You just need to know which one to consult when you have a problem to solve or a strategy to validate.
Your goal isn't just to track sales; it's to understand the story behind the numbers. Why did sales spike last Tuesday? Which marketing channel is bringing in your most valuable customers? Shopify's native reports hold these answers.
To make this super practical, let's look at how you can map common business questions directly to the reports that will give you the answers. Think of this as your cheat sheet for moving from just looking at data to actually using it to find solutions.
Key Shopify Reports And The Business Questions They Answer
Here’s a simple breakdown of the most essential reports inside Shopify and the specific strategic questions each one helps you solve.
| Shopify Report Name | Key Metrics Included | Business Question It Answers |
|---|---|---|
| Sales over time | Gross sales, Net sales, Orders | "Are my sales growing month-over-month, and what are my busiest days?" |
| Online store conversion rate | Sessions, Added to cart, Reached checkout, Sessions converted | "How effective is my website at turning visitors into customers?" |
| Top products by units sold | Units sold, Net sales, Product title | "Which products are my best-sellers and should I promote them more?" |
| Sales by traffic source | Sessions, Orders, Sales by marketing channel | "Which of my marketing channels (e.g., social, search) is driving the most revenue?" |
| Average order value | Total sales, Total orders | "How can I encourage customers to spend more in a single transaction?" |
By starting with the question first, you can go straight to the source and get the information you need to make a real impact on your store's performance.
Integrating Google Analytics 4 for a Complete Customer View
While Shopify’s built-in reports are fantastic for seeing what happens inside your store, they don't give you the full story of how customers found you in the first place. This is where Google Analytics 4 (GA4) becomes an absolutely essential tool in your Shopify sales tracker toolkit. It’s what connects the dots across the entire customer journey, from that first ad they clicked to the final purchase.
Think of it this way: Shopify Analytics is your store’s financial ledger—it's precise, transaction-focused, and tells you what you sold. GA4, on the other hand, is your customer behavior detective, piecing together clues from every interaction across different channels and devices.
Why GA4 is a Game Changer for Shopify Stores
GA4 operates on an "event-based" model, which is a major shift from older analytics platforms. Instead of just counting pageviews, it tracks meaningful actions—a scroll down a product page, a video play, adding an item to the cart. This gives you a much richer, more nuanced understanding of how people actually engage with your site.
This level of detail is critical, especially during huge shopping events. For instance, Shopify merchants brought in a mind-boggling $14.6 billion during the 2025 Black Friday Cyber Monday weekend. That's a massive 27% jump from 2024's $11.5 billion. With 79% of that traffic coming from mobile and Shopify powering 5.8 million live stores, you need advanced analytics to make sense of the frenzy. You can dig into more of these incredible stats on Shopify's official BFCM data page.
A real-world example of GA4's power is building smarter audiences for remarketing. You can easily create a segment of users who viewed a specific product category—say, "women's running shoes"—but never added anything to their cart. Then, you can hit them with highly specific ads for those exact shoes on Google or social media.
This simple diagram breaks down how to turn raw data into smart business decisions.
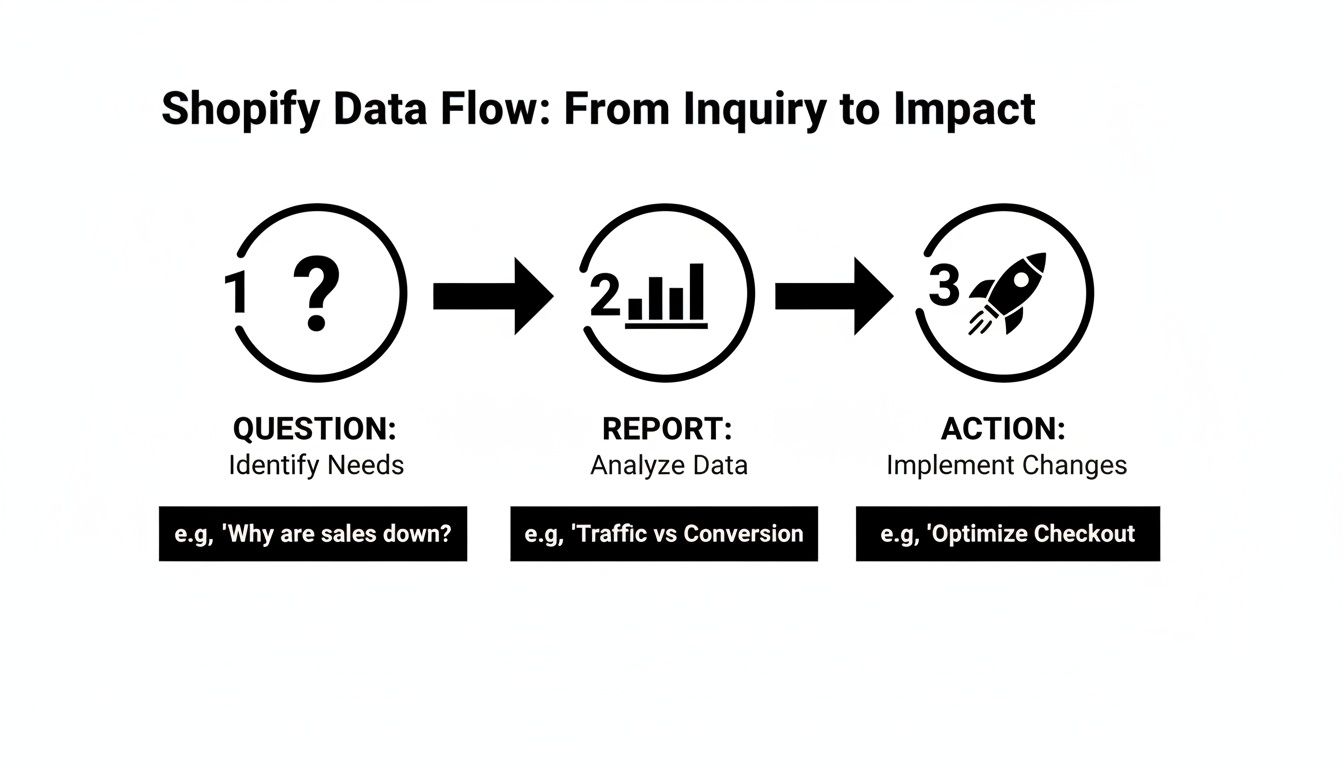
It really all boils down to asking the right questions, finding the answers in your reports, and then taking action.
Navigating Setup and Common Hurdles
Shopify has made getting started with GA4 pretty painless through its native "Google & YouTube" channel app. This integration automatically handles the setup for key e-commerce events like add_to_cart, begin_checkout, and purchase, which makes the initial configuration fairly straightforward for most store owners.
However, one thing that trips up a lot of new users is data discrepancies. You'll almost certainly see that your sales numbers in Shopify don't perfectly match what GA4 is reporting. Don't panic—this is normal and totally expected.
Here’s why they often don't line up:
- Attribution Models: Shopify typically gives 100% of the credit for a sale to the very last click. GA4, by default, uses a more sophisticated data-driven model that might distribute that credit across several touchpoints (like a blog post, an email, and a final ad click).
- Ad Blockers: Many browser extensions and privacy tools actively block the GA4 tracking script, meaning some user sessions simply never get recorded in Google Analytics.
- Timezones: If your timezone settings don't match exactly between Shopify and GA4, your daily sales totals will naturally be a bit different.
For those who crave more control over their tracking—maybe you want to implement custom events or integrate other marketing pixels—the next logical step is setting up Google Tag Manager on Shopify. GTM acts as a central hub for all your tracking tags, giving you far more flexibility and power to build a truly comprehensive view of your customer journey.
Creating Custom Reports and Automated Alerts

While standard reports give you a decent overview, the real magic happens when you create custom views that zero in on your specific business goals. Raw data is just noise. The trick is filtering it to answer your most important questions, moving from just looking at data to actively monitoring what matters.
Let’s say you just launched a new product and you're pushing it hard with a new TikTok campaign. Instead of digging through a mountain of general sales data, you could build a custom report in Shopify that only shows you that specific product's performance.
Suddenly, you can see its conversion rate, where sales are coming from (especially from social), and the average order value—all in one clean dashboard. It’s an instant, uncluttered look at your campaign's ROI.
Building Your Custom Shopify Reports
If you’re on one of Shopify’s advanced plans, you have some seriously powerful report customization features at your fingertips. You can take any standard report and filter it by dozens of different dimensions to get exactly what you need.
A good place to start is with a base report, like "Sales by product." From there, you can start layering on filters. For instance, you could filter by:
- Product Vendor: To see which of your suppliers are actually making you money.
- Discount Code: To measure the precise revenue a specific promo code generated.
- Customer Tag: To track the buying habits and lifetime value of your VIPs.
This is how a generic sales tracker becomes a sharp diagnostic tool, helping you make smart decisions without the guesswork.
The best custom reports are the ones you build to track a specific goal. Don't just create reports for the sake of it. Build them with a clear question in mind, like, "How did our weekend flash sale impact the AOV for first-time buyers?"
Setting Up Proactive Automated Alerts
A custom report is great for when you remember to check it, but automated alerts are your 24/7 store watchdogs. They work for you in the background, pinging you the moment something important happens so you can act immediately. This proactive approach helps you jump on opportunities and squash problems before they get out of hand.
Think about setting up alerts for specific scenarios that need your attention. A classic example is configuring an alert in Google Analytics 4 to email you if a key conversion event, like add_to_cart, suddenly drops by more than 20% in a single day. That’s a huge red flag that could mean a broken button or a technical glitch on a product page.
Here are a few other powerful alerts you could set up:
- Get a notification when a discount code is used over 100 times in an hour. This could signal fraud or a viral promotion you need to keep an eye on.
- Get an alert when your average order value dips below a certain dollar amount, which might prompt you to check if your upselling features are working correctly.
These kinds of automated systems ensure you’re never caught by surprise. When you combine focused custom reports with smart alerts, your Shopify sales tracker transforms from a simple reporting tool into a dynamic system that helps you actively shape your store's success.
Turning Sales Data Into Actionable Growth Strategies

This is where the rubber meets the road. Connecting your insights to actual income is where your Shopify sales tracker really earns its keep. It’s the bridge between just looking at data and making smart moves that actually boost your bottom line.
So, let's get practical. The whole point of tracking sales is to figure out How To Analyze Sales Data in a way that fuels your store's growth. You're building a playbook that shows you exactly what actions lead to better results.
From High Traffic to High Conversions
It’s a classic problem I see all the time: plenty of website visitors, but the sales just aren't there. Your analytics are showing a ton of sessions, but your conversion rate is painfully low. This is a "leaky bucket," and your data is what you'll use to find and plug the holes.
Start by digging into your 'Top landing pages' report, whether you're using Shopify Analytics or GA4. This tells you the front door most of your traffic is using. Are those pages actually built for a first impression? Do they have clear calls-to-action (CTAs) and give visitors a compelling reason to stick around?
For instance, if you have a blog post that’s pulling in thousands of visitors but has a 95% bounce rate, that’s your first action item. That page needs an overhaul. You could add better internal links to your product pages, embed a product collection right in the article, or even offer a unique discount code just for readers. For a deeper dive, our guide on how to improve ecommerce conversion rates is packed with tips.
Boosting Your Average Order Value
Another common hurdle is a low Average Order Value (AOV). You've got customers who are happy to buy, but they're only grabbing one small thing at a time. This can crush your profit margins, since every single order has its own set of fulfillment and shipping costs.
To tackle this, your 'Top products by units sold' report is your new best friend. It’s not just a list of bestsellers; it's a treasure map for AOV-boosting tactics.
- Find Bundling Opportunities: Look for a few products that people are often buying, even if it's in separate orders. Package them together as a bundle and offer a slight discount. Simple, but effective.
- Create Strategic Upsells: Take your most popular mid-range product. Now, find a slightly more premium version or a complementary, high-margin accessory. Use an app to offer this as an upsell on the product page or right in the cart.
- Set Smart Shipping Thresholds: First, figure out your current AOV. Then, set your free shipping threshold about 15-20% higher. This is a gentle nudge that often convinces shoppers to add one more item to their cart to qualify.
Your sales tracker isn't just a report card for what happened last week. Think of it as a crystal ball that helps you shape your sales and marketing strategies for next week.
Shopify is a massive force in ecommerce, contributing $444 billion to the global economy in 2023 alone while powering millions of stores. This huge marketplace is ripe with opportunity, especially for dropshippers who can quickly list new products. By turning your data into real-world action, you're positioning your own store to grab a bigger piece of that pie.
Common Questions About Tracking Shopify Sales
Diving into analytics can feel like opening a can of worms. You’re trying to build a solid Shopify sales tracker, but every new report seems to bring up more questions. Let's walk through some of the most common puzzles store owners run into and clear them up with some straightforward advice.
Why Do My Shopify and Google Analytics Sales Numbers Not Match?
This is, without a doubt, the question I hear most often. The short answer? They're not supposed to match perfectly. It's totally normal to see different numbers, and it's less of an error and more like two different tools telling you two different parts of the same story.
Think of it this way: Shopify records a sale the instant a transaction goes through. It's your single source of truth for all things financial. Google Analytics 4 (GA4), however, tells the story of how that sale happened. It looks at the customer's entire journey and uses attribution models (like its default "data-driven" model) to give credit to the various touchpoints—maybe an ad, an email, and a social post—that led to the purchase.
A few other common culprits for the mismatch include:
- Ad Blockers: A surprising number of browser extensions block the GA4 tracking script, which means Google Analytics simply never "sees" some of the sales that Shopify records.
- Timezone Settings: If your timezone settings in Shopify and GA4 don't align, your daily sales reports will naturally be out of sync. It's a simple but often-overlooked detail.
- Refunds and Returns: Shopify’s reports update to reflect refunds, which is great for accounting. GA4, on the other hand, usually keeps the original conversion data as is.
The best approach is to see them as complementary. Use Shopify for financial accuracy—what you actually banked. Use GA4 for deep insights into marketing performance and how your customers behave.
What Are the Most Important Metrics for a New Shopify Store?
When you’re just starting out, it's so easy to drown in data. My advice? Forget about all the vanity metrics and just focus on a handful of core numbers. If you get a good handle on these five, you'll know 80% of what you need to make smart decisions early on.
- Online Store Conversion Rate: Of all the people who visit, what percentage are actually buying?
- Average Order Value (AOV): On average, how much do customers spend each time they check out?
- Top Landing Pages by Sessions: Where is your traffic landing first? This tells you what's drawing people in.
- Top Products by Units Sold: What's actually selling? This shows you what's resonating with your audience.
- Sales by Traffic Source: Which marketing channels are genuinely making you money?
How Often Should I Check My Shopify Sales Data?
There's no single right answer here—it really depends on your store's sales volume. If you're running a high-volume store, a quick daily check-in is a good idea. A quick glance at sales and conversion rate can help you spot any sudden problems, like a broken checkout page, before they do real damage.
For most stores, a detailed weekly review hits the sweet spot. It gives you enough data to spot real trends without getting caught up in the normal day-to-day ups and downs. Then, save the deep-dive for a monthly review. This is the perfect time to look at the big picture, assess how your marketing campaigns are performing over time, and set new goals.
Streamline your workflow and create stunning product listings in minutes. With AliSave Pro, you can download all AliExpress product photos, videos, and variant images in a single click, completely free. Join over 20,000 sellers who use our tool to build their stores faster. Get started at alisavepro.com.