

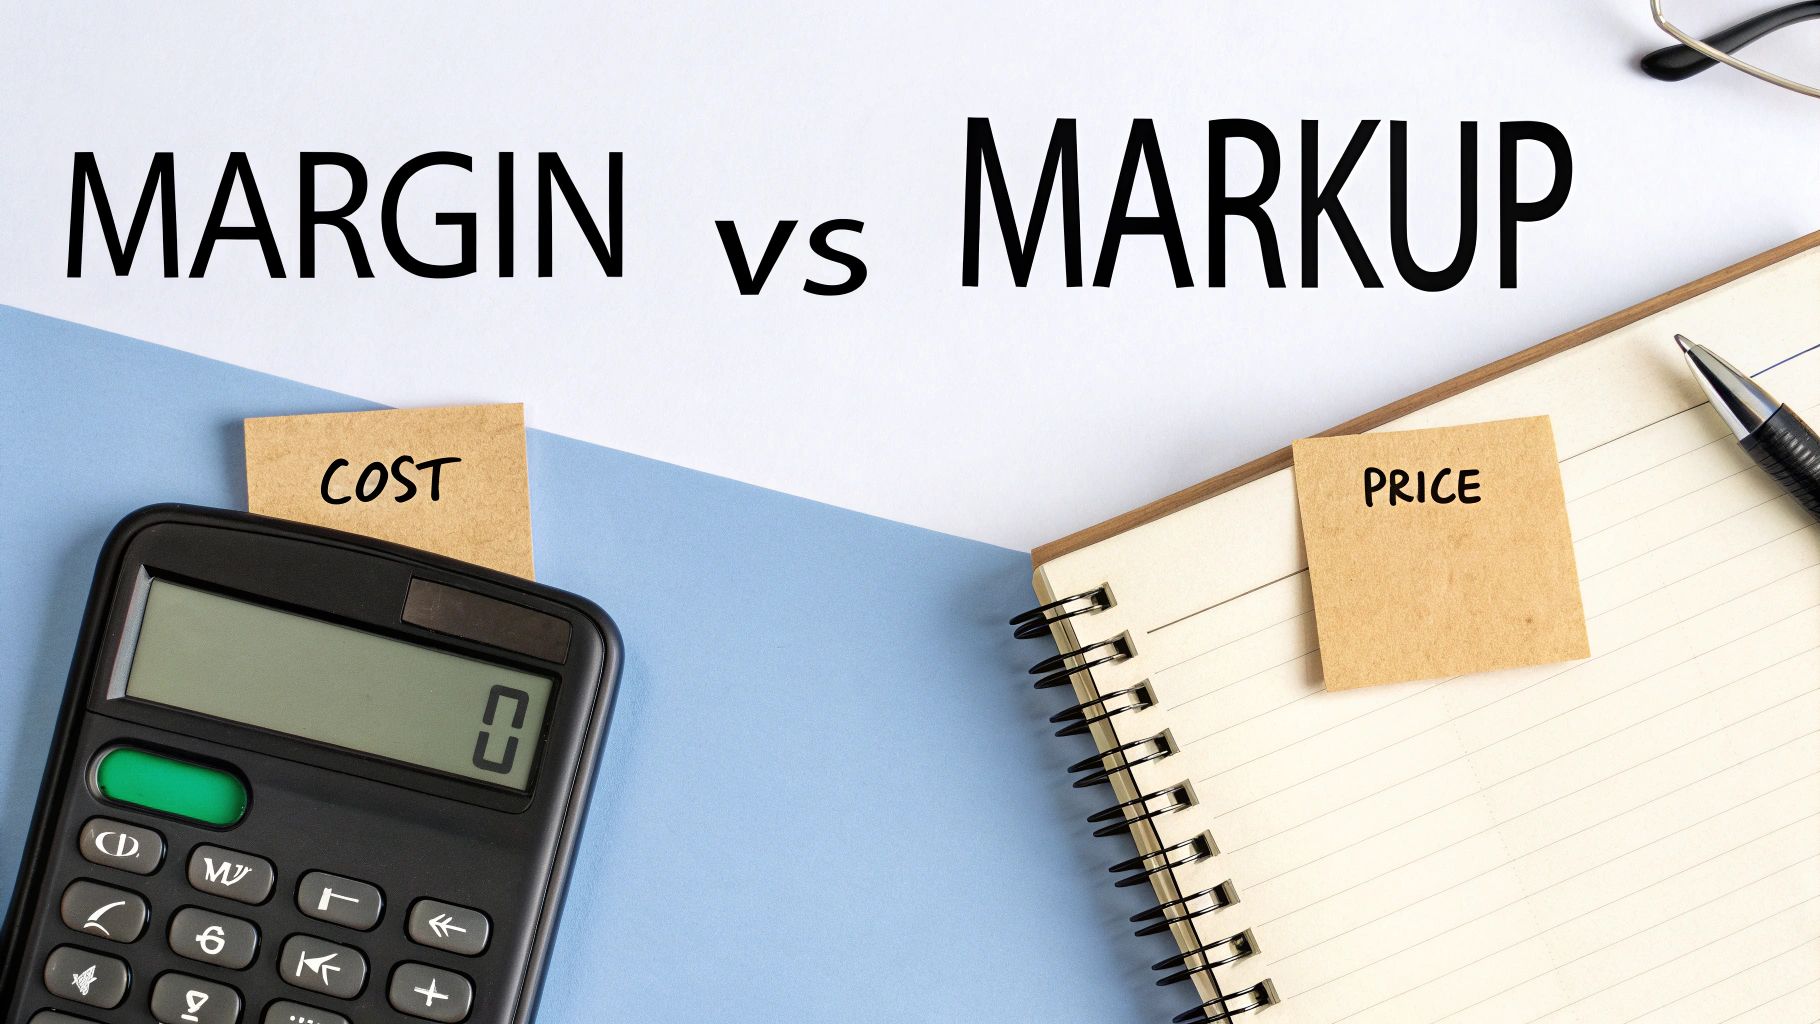
To really nail your pricing, you first have to get one thing straight: margin and markup are not the same thing. It's a surprisingly common mistake, but confusing the two can quietly kill your profits.
Both metrics deal with profitability, but they look at it from different angles. Margin shows you your profit as a percentage of your revenue—the final selling price. Markup, on the other hand, calculates profit as a percentage of your costs.
Let's break it down with a simple example.
Imagine you're dropshipping a desk lamp. You source it from your supplier for $50, and you sell it in your store for $100. Your profit is a clean $50.
- Your markup is 100%. Why? Because you doubled the cost. You marked it up by the same amount you paid for it.
- ($50 Profit / $50 Cost) x 100 = 100%
- Your sales margin, however, is 50%. This is because profit makes up half of the final revenue.
- ($50 Profit / $100 Revenue) x 100 = 50%
See the difference? If you thought a 100% markup meant you were making a 100% margin, you'd be way off. This isn't just semantics; it's the kind of miscalculation that leads business owners to underprice their products and wonder why they're not making any real money.
Why This Distinction Is So Critical
Getting this right is fundamental to your financial health. Each metric gives you a different, vital piece of the puzzle.
I always tell people to think of it like this: Margin is your "health" metric. It's a true indicator of your profitability because it's based on actual revenue. It answers the question, "For every dollar that comes in, how many cents are pure profit?" Markup is more of a "tool" metric, something you use on the front end to decide on a selling price based on your costs.
This is why you see such a wide range of "good" margins across different industries. A software company might boast gross margins of 75% to 85%, while a construction business could be running lean at 15% to 20%. If you don't know whether you're calculating margin or markup, you have no way of knowing how you stack up against your competitors.
To help you keep these two straight, here's a quick reference table.
Margin vs Markup At a Glance
This table breaks down the essential differences between the two key profitability metrics at a glance.
| Metric | Formula | What It Measures |
|---|---|---|
| Sales Margin | (Revenue - COGS) / Revenue |
The percentage of revenue that is pure profit. |
| Markup | (Revenue - COGS) / COGS |
How much the cost was increased to get the selling price. |
Getting a firm handle on both is the first step toward building a sustainable pricing strategy. If you want to dig a bit deeper into the math, this guide on how to calculate markup and margin for profit is a great resource. Once you're confident in the distinction, you'll be ready to calculate your sales margin and use it to make smarter decisions for your business.
The Essential Sales Margin Formulas You Need
To get a real handle on your profitability, you need the right formulas. Thankfully, the math behind sales margin is pretty simple, but the insights it gives you are incredibly powerful for understanding your business's health.
The most important place to start is with your Gross Profit Margin.
This number tells you exactly what percentage of your revenue is left over after paying for the products you sold. Think of it as the purest measure of your product's profitability before any overhead like marketing or software costs come into play.
The formula is straightforward:
Gross Profit Margin = ((Revenue – COGS) / Revenue) * 100
Let's quickly break that down:
- Revenue: This is just the total money you brought in from sales. It's your retail price multiplied by the number of items you sold.
- Cost of Goods Sold (COGS): These are the direct costs tied to getting the product to your customer. For a dropshipper, this is mainly what you pay your supplier for the item, plus any direct shipping fees. Getting this number right is critical, so check out our guide on how to calculate cost per unit to make sure you're not missing anything.
Gross Margin in Action
Let’s say you sell a wireless charger for $40. Your all-in cost from the supplier, including shipping, is $15 (that’s your COGS).
Plugging those numbers into the formula, it looks like this:
(($40 Revenue – $15 COGS) / $40 Revenue) * 100 = 62.5%
Your gross profit margin is 62.5%. What that really means is for every dollar in sales this charger brings in, you’re left with 62.5 cents to cover all your other business expenses and, hopefully, take home as profit. It's a fantastic snapshot of a product's potential.
Taking It a Step Further with Net Profit Margin
Gross margin is a vital health check, but it doesn't paint the complete picture. For that, you need to look at your Net Profit Margin. This is the real bottom line.
This calculation factors in all your business expenses, not just the cost of the product itself. It answers the most important question: "After every single bill is paid, what's actually left?"
Your Net Profit Margin is the truest measure of financial success. It reveals what your business actually earns after covering not just the product itself, but also the operational costs required to market, sell, and deliver it.
Here’s the formula for Net Profit Margin:
Net Profit Margin = (Net Income / Revenue) * 100
In this formula, Net Income is your revenue minus your COGS and all your other operating costs—think marketing campaigns, software subscriptions, salaries, transaction fees, and taxes. It’s more work to calculate, for sure, but getting this number right gives you total clarity on the true financial health and long-term sustainability of your business.
Applying Margin Formulas to Real Business Scenarios
Knowing the formula is one thing, but actually putting it to work in the day-to-day chaos of running a business is another story entirely. So, let's get our hands dirty and move past the theory. We'll walk through how to calculate sales margin in situations you’ll actually face, starting simple and building up to more complex ecommerce challenges.
This quick visual breaks down the process, showing how you go from total revenue, subtract your costs, and land on that all-important margin percentage.
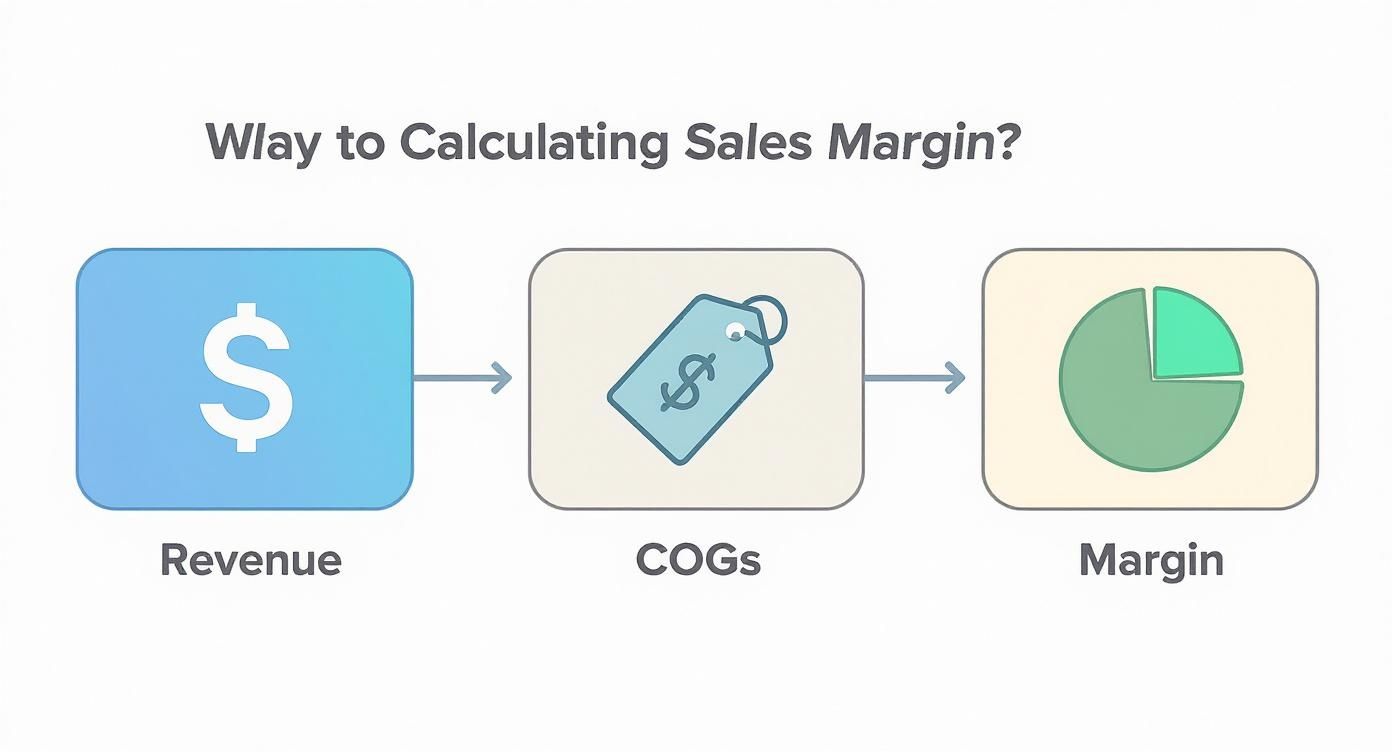
As you can see, margin is always viewed as a piece of your revenue, which is exactly why it’s such a powerful way to gauge profitability.
Calculating Margin for a Single Product
Let's start with a straightforward example to get the fundamentals down. Imagine you're selling a premium coffee grinder.
- Retail Price (Revenue): You sell each one for $75.
- Cost of Goods Sold (COGS): It costs you $30 to get one from your supplier.
To figure out the sales margin, we just pop these numbers into our formula: ((Revenue - COGS) / Revenue) * 100.
So, that looks like: (($75 - $30) / $75) * 100.
This simplifies to ($45 / $75) * 100, which gives us a sales margin of 60%. Simple as that. This means for every dollar you make selling this grinder, 60 cents is gross profit that you can use to cover all your other business expenses.
Navigating Products with Multiple Variants
Things get a little more interesting when you sell products with different options, like t-shirts in various sizes or colors. The catch is that these variants can sometimes have different costs. For instance, a 3XL shirt might cost you more to source than a Small.
Let's say you sell two versions of a custom-printed t-shirt:
- Small/Medium Shirt: Sells for $25, but your COGS is $8.
- 3XL Shirt: Sells for $28, and the COGS is higher at $11.
In a given month, you sell 100 S/M shirts but only 20 of the 3XL version. You can't just pick one variant's margin and call it a day. You need to calculate the average margin across the entire product line.
First, let's find the total revenue and total COGS for the month:
- Total Revenue:
(100 * $25) + (20 * $28) = $2,500 + $560 = $3,060 - Total COGS:
(100 * $8) + (20 * $11) = $800 + $220 = $1,020
Now, we can apply the margin formula to these totals: (($3,060 - $1,020) / $3,060) * 100. The result is an average gross margin of 66.7%. This weighted average gives you a much more accurate picture of how the t-shirt is truly performing.
Calculating an average margin for variants is non-negotiable. It prevents you from getting a false sense of security from the high margin of a popular size while a less common, more expensive variant quietly eats away at your profits.
The Challenge of Product Bundles
Bundles are an excellent sales strategy, but they can definitely complicate your margin calculations. Imagine you create a "Beginner's Knitting Kit" that you sell as a single unit.
Here’s what’s inside and what each piece costs you:
- Yarn: COGS = $12
- Knitting Needles: COGS = $7
- Pattern Book: COGS = $4
The total COGS for the bundle is the sum of its parts: $12 + $7 + $4 = $23. You’ve decided to price the entire kit at $50.
With the total COGS figured out, the margin calculation becomes simple again: (($50 - $23) / $50) * 100 = 54%.
The absolute key here is to be meticulous. You have to add up the COGS for every single item in that bundle. If you miss one small component, you'll accidentally inflate your margin on paper and make poor pricing decisions down the line. This is especially true for merchants who buy in bulk for resale, since bundle components often come from different suppliers or purchase orders.
To truly understand profitability, you also need a handle on all the hidden expenses. A great place to start is learning about inventory carrying costs and how to reduce them. As these examples show, once you get organized, you can apply the same core formula to just about any product you can dream up.
How to Automate Your Margin Calculations
Sure, calculating sales margins for a couple of products is easy enough. But what happens when your catalog balloons to dozens, or even hundreds, of items? That’s when manual calculations become a massive time-suck and, frankly, a dangerous liability. One tiny typo can lead to a costly error that silently eats away at your profits for weeks.
The answer isn't to work harder; it's to work smarter by automating the whole process.

You don't need fancy, expensive software to pull this off. One of the most powerful tools you already have is a simple spreadsheet. Setting up a basic template in Google Sheets or Excel gives you an instant, bird's-eye view of your product profitability, letting you make sharp, data-driven decisions on the fly.
Building Your Spreadsheet Calculator
Let's walk through creating a simple but incredibly effective margin tracking sheet. The goal here is a clean, at-a-glance dashboard for your product margins.
First, open a new spreadsheet and set up these columns:
- A: Product Name: The item name or SKU.
- B: Sale Price: What the customer actually pays.
- C: Cost of Goods Sold (COGS): Your total cost to acquire the product.
- D: Gross Profit: The raw dollar profit from a sale.
- E: Sales Margin (%): The all-important profitability percentage.
This simple layout keeps your data organized and easy to scan. Now, let's make it work for you with some simple formulas.
Copy-Paste Formulas for Instant Calculations
This is where the magic happens. The beauty of a spreadsheet is that you do the thinking once, and it handles the rest. Once the formulas are in, you just drag them down, and they'll apply to your entire product list.
Go ahead and plug your product data into columns A, B, and C. Then, click on cell D2 (your first cell under Gross Profit) and type in this formula:
=B2-C2
Easy, right? Next, click on cell E2 (your first cell under Sales Margin) and enter this formula to get the margin percentage:
=(B2-C2)/B2
One last tweak: select all of column E and format it as a percentage. In both Google Sheets and Excel, there's a handy "%" button right in the toolbar. Now, whenever you add a new product's sale price and COGS, its gross profit and sales margin will pop up instantly.
Think of this spreadsheet as more than just a calculator—it's your business's financial command center. It shows you which low-margin products need a price adjustment, highlights your true profit-drivers, and gives you the confidence to run promotions without accidentally giving away the farm.
This simple automation takes all the guesswork and tedious number-punching out of the equation. You're free to focus on strategy.
Want to take it a step further? Use conditional formatting to automatically highlight any product that dips below your target margin. For instance, you could set a rule to turn any cell with a margin below 30% red. It's a powerful visual cue that makes it impossible to ignore the products that are dragging you down.
Common Margin Calculation Mistakes That Can Cost You
Knowing the formulas is one thing, but getting your numbers right in the real world means sidestepping the common traps that can throw everything off. A tiny mistake here isn't just a math error; it’s a decision-making disaster waiting to happen, leading to bad pricing and a skewed view of your business's health.
Let's walk through the most common mistakes I see people make, even sellers who have been at this for a while.
Forgetting the "Hidden" Costs in Your COGS
The single biggest blunder? Underestimating your Cost of Goods Sold (COGS). Too many entrepreneurs just plug in the price from their supplier and call it a day. That’s a dangerously incomplete picture and will always make you think you're more profitable than you actually are.
Your true COGS has to include every single expense that exists only because you made a sale. These little costs add up fast and quietly devour what you thought was profit.
- Payment Processing Fees: That 2.9% + 30¢ fee from Shopify Payments or Stripe isn't just a business expense—it's a direct cost of that specific transaction. It belongs in your COGS.
- Shipping Supplies: Mailers, boxes, tape, and labels might seem insignificant one by one, but they become a real cost when you're shipping hundreds of orders.
- Marketplace Commissions: Selling on a platform like Amazon or Etsy? Their cut is a direct sales cost.
- Currency Conversion Fees: If you're a dropshipper paying your supplier in a different currency, those conversion fees nibble away at the margin on every single sale.
Dismissing these costs is a massive error. Research from S&P Global recently highlighted that companies are getting hit with an unexpected $1.2 trillion in rising expenses, squeezing their margins hard. You can dive deeper into these trends and learn how they impact margin math. Your best defense is to be ruthless about accounting for every penny.
If a cost only exists because you made a sale, it belongs in your COGS. Period. Treating transaction fees or packaging as general business overhead will always make your product margins look better than they actually are.
Applying Markup Logic to Margin Goals
Here's another classic mix-up: using markup math to hit a margin target. We've already established they aren't the same thing. A 50% margin is not a 50% markup—it’s actually a 100% markup. This confusion trips people up constantly when setting prices.
Imagine you want to hit a 40% margin on a product that costs you $30. The rookie mistake is to just add 40% to the cost ($30 * 1.40 = $42). But if you run the numbers, you'll see the problem. The actual margin for that price is (($42 - $30) / $42) * 100 = 28.6%. You've fallen way short of your goal.
To properly hit a target margin, you have to work backward from the selling price you want to end up with. The formula you need is: Retail Price = COGS / (1 – Desired Margin Percentage).
So, for our 40% margin goal on that $30 item, the calculation looks like this: $30 / (1 - 0.40) = $50. Now that's how you hit your target.
By getting ahead of these common slip-ups, the numbers you're looking at will finally reflect reality. That accuracy is what turns sales margin from a simple metric into a powerful tool you can trust to make smart, profitable decisions for your business.
Using Sales Margin to Drive Your Pricing Strategy
https://www.youtube.com/embed/U7BB1qNytcs
Figuring out your sales margin is just the first step. The real magic happens when you start using that number to make smarter, more profitable decisions for your business. Think of your margin not as a static number on a spreadsheet, but as your strategic compass for pricing.
Instead of just plucking a price out of thin air and hoping for the best, you can start with the end in mind. Let’s say you’ve determined you need to maintain a healthy 40% margin across the board. Now, for any new product you're thinking of adding, you can instantly calculate the absolute minimum you need to sell it for. This simple, proactive step stops you from ever launching a product that's set up to fail from the start.
Identify Your Winners and Losers
One of the most powerful things you can do for your store is to lay out the margins for every single product you sell. This exercise is incredibly revealing. It quickly shines a spotlight on which items are your true profit engines—your "hero" products—and which ones are just dragging you down, barely adding anything to your bottom line.
Once you have this clarity, you know exactly where to put your time and money.
- High-Margin Heroes: These are the products that fuel your growth. Funnel more of your marketing budget here. Run more ads, create more content—do whatever it takes to get these in front of more people.
- Low-Margin Laggards: These items need a second look. Is it possible to get a better price from your supplier? If not, it might be time to confidently raise the retail price.
The confidence to adjust prices is a massive lever for profitability. In fact, companies that have a strong handle on their pricing power often enjoy a profit margin premium of around 3 percentage points over their competitors. You can dig deeper into how intelligent pricing impacts profit margin to see the full effect.
When you know your margins inside and out, you can run promotions and sales without just guessing. You’ll know precisely how deep you can discount an item before a sale starts costing you money, turning discounts into a strategic lever instead of a shot in the dark.
This knowledge is also critical when you're crafting special offers. By knowing the individual margins of different products, you can build compelling and profitable product bundles. This is the whole idea behind a smart bundle pricing strategy, which helps you boost your average order value without gutting your overall profit. At the end of the day, having a firm grasp on your numbers gives you the control you need to steer your business toward long-term, sustainable growth.
When you find those hero products on AliExpress and need top-notch images and videos for them, AliSave Pro is the tool you need. It lets you download every single product photo, variant image, and video in just one click. Use them to build high-converting ads and stunning product pages that sell. Grab the official AliSave Pro Chrome Extension and start streamlining your creative process today.